Curriculum
Smart4Food MicroLearning Course
INTRODUCTION
0/1
Module 1: Digital Tools for Smart Farming
0/22
-
MODULE 1 - INFORMATION
 Trial
-
MODULE 1 - INTRODUCTION
Trial
-
UNIT 1 - INTRODUCTION TO DIGITAL AGRICULTURE AND SMART FARMING TOOLS
Trial
-
UNIT 1 - QUIZ
 Trial
-
UNIT 1 - REFLECTION ACTIVITY
Trial
-
UNIT 2 - DIGITAL RECORD-KEEPING FOR FARM MANAGEMENT
Trial
-
UNIT 2 - REFLECTION ACTIVITY
Trial
-
UNIT 2 - QUIZ
Trial
-
UNIT 3 - REMOTE SENSING AND GEOSPATIAL ANALYSIS
Trial
-
UNIT 3 - IMAGE ACTIVITY: DESCRIBING NDVI PATTERNS
Trial
-
UNIT 3 - QUIZ
Trial
-
UNIT 4 – IoT SENSORS AND SMART IRRIGATION
Trial
-
UNIT 4 - SIMULATED DASHBOARD ACTIVITY
Trial
-
UNIT 4 - QUIZ
Trial
-
UNIT 5 – ARTIFICIAL INTELLIGENCE AND DATA ANALYTICS
Trial
-
UNIT 5 - WEATHER FORECAST ACTIVITY
Trial
-
UNIT 5 - QUALITATIVE COMPARISON ACTIVITY
Trial
-
UNIT 5 - QUIZ
Trial
-
UNIT 6 - DATA ETHICS, CYBERSECURITY AND SUSTAINABILITY
Trial
-
UNIT 6 - READING ACTIVITY
Trial
-
UNIT 6 - CASE SCENARIO ACTIVITY
Trial
-
UNIT 6 - QUIZ
Trial
Module 2: Sustainable and Regenerative Agriculture: Soil, Water and Biodiversity Management for Small-Scale Farms
0/16
Module 3 - Smart Marketing and Communication for Small Producers
0/27
Module 4 - Local Food Systems and Short Supply Chains
0/14
Module 5 - Training and Education for Rural Development
0/14
Module 6 - Policy Innovation and Project development in the Agrisector
0/15
UNIT 3 – IMAGE ACTIVITY: DESCRIBING NDVI PATTERNS
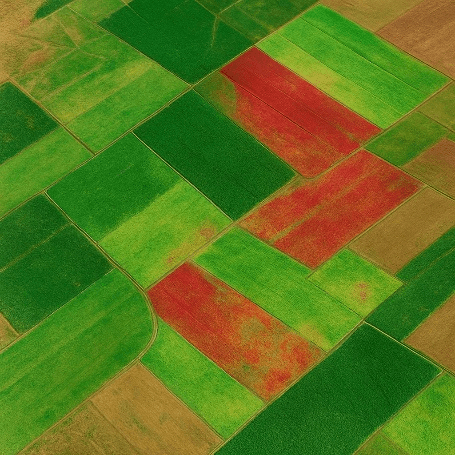
You see a sample NDVI satellite image showing a farm plot with different shades of green and brown. Review the image and consider the prompts below.
1. Identify a low-NDVI area
Look for brown or yellowish areas (indicating low NDVI) and describe where they are located (e.g., “north-east corner of the field”).
2. Explain the possible cause
Suggest a reason for the low NDVI: drought stress, poor soil fertility, pest infestation, or recent harvesting.
3. Identify a high-NDVI area
Look for dark green areas (high NDVI) and describe their location.
4. Explain why NDVI is high
Consider factors such as adequate moisture, healthy crops, or good management practices.
Model Responses (for Self-Assessment)
Low-NDVI area:
“The south-west corner appears brown, indicating low NDVI. This could be due to water stress or soil degradation.”
High-NDVI area:
“The central portion of the field shows dark green pixels, suggesting healthy vegetation with adequate moisture.”
Weather and Soil Data Services
Review the examples below showing digital services that provide weather or soil data and how farmers use them in practice.
| Service Name | How Farmers Use It |
|---|---|
| ISU Soil Moisture Network | Monitors soil temperature and moisture at various depths. Farmers use this data to determine optimal planting times (e.g., corn germination around 50 °F). |
| CoCoRaHS (Community Collaborative Rain, Hail & Snow Network) | Provides local rainfall data searchable by site and date. Farmers use it to track precipitation patterns and plan irrigation. |
| National Weather Service (NWS) Tabular Forecast | Offers hourly forecasts of wind speed, direction, and temperature. Farmers use this information to schedule spraying and field operations. |
| NASA Soil Moisture Portal | Estimates volumetric soil moisture at different depths. Farmers use it to assess drought risk and plan irrigation. |
Learners are encouraged to explore additional services they may already know, such as local weather applications or agronomic platforms.